> For the complete documentation index, see [llms.txt](https://docs.letsmetrix.com/llms.txt). Markdown versions of documentation pages are available by appending `.md` to page URLs; this page is available as [Markdown](https://docs.letsmetrix.com/shopify-metrics/active-users.md).
# Active Users
The “Active Users” dashboard tracks the total number of active shops currently using your app.
### How we get these data
Active Users data is retrieved from Shopify API App Events for analysis and insights.
This is a snapshot metric, calculated by the final status of each unique user.
### Understand the dashboard
Active Users (or Active Shops) is the total number of **unique shops** currently having the application installed at the time of reporting (including New Users).
* This metric represents the size of the existing customer base (Installed Base).
* It excludes shops that have uninstalled (Uninstalled) and shops that have been closed/frozen (Frozen/Deactive).
#### 1. Active Users
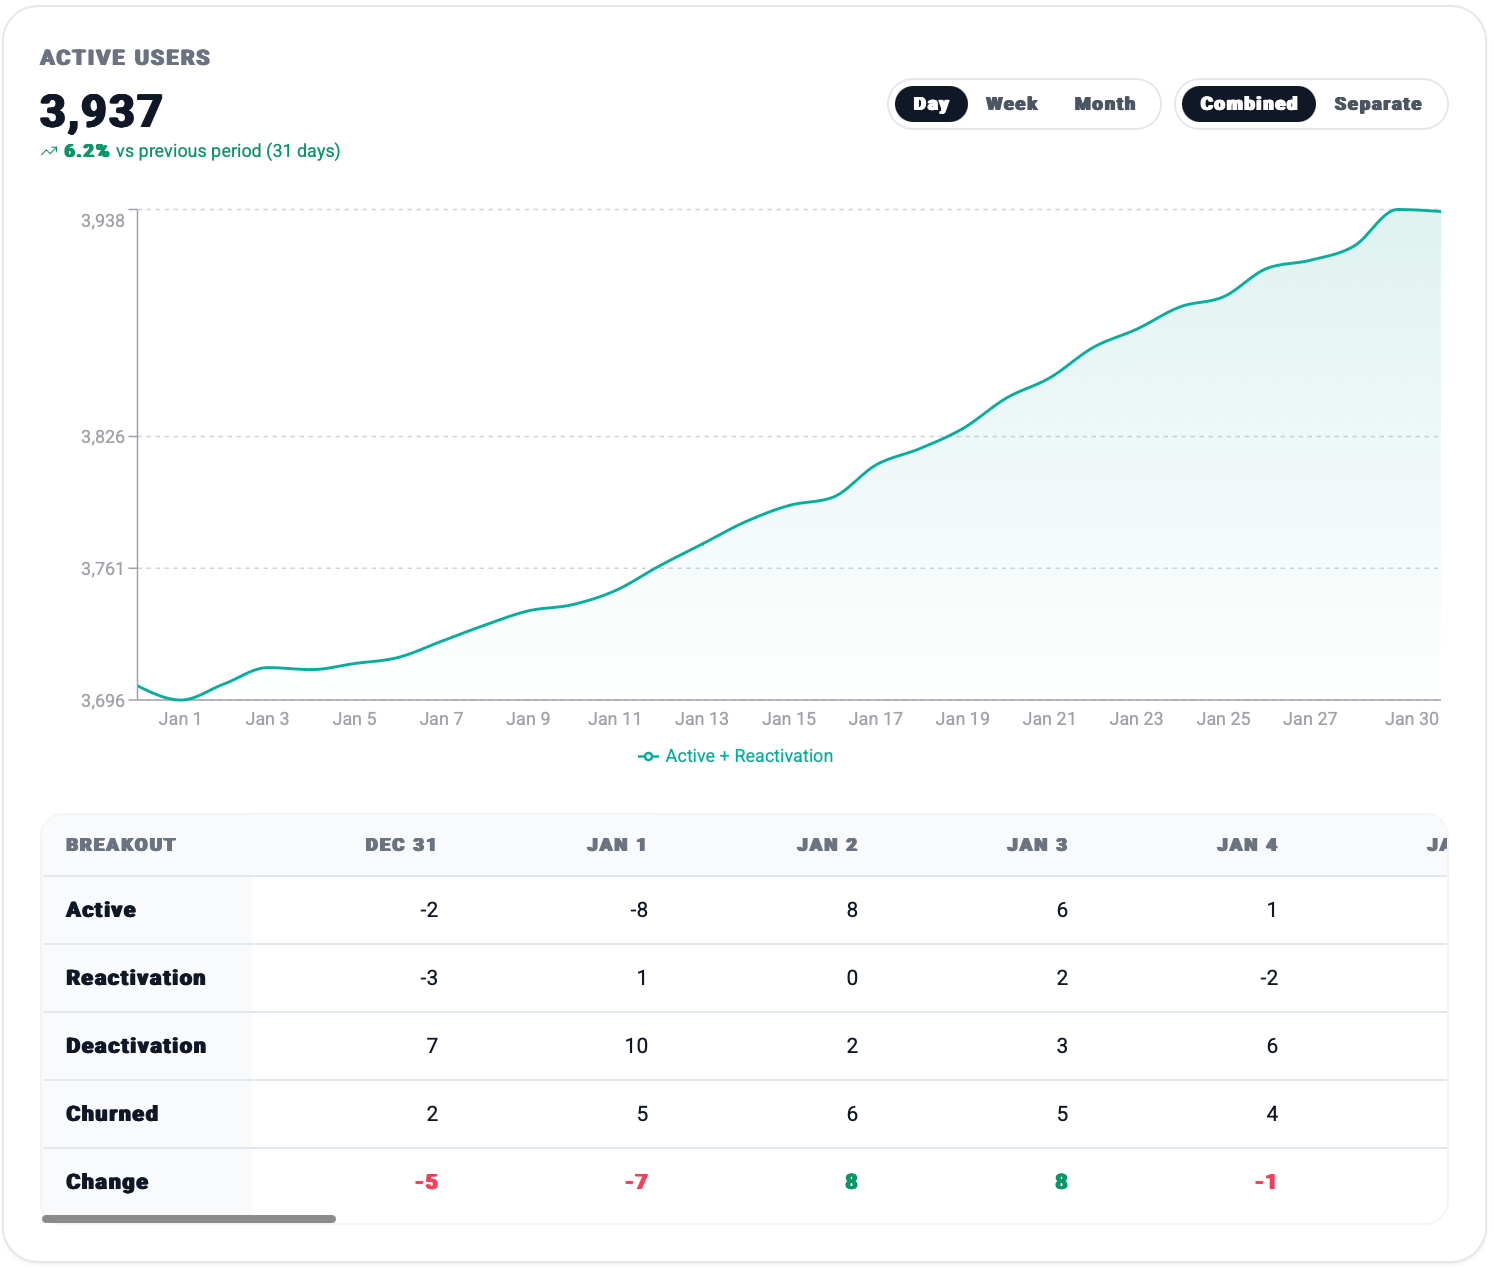
The chart visualizes the total number of active users over your selected time period (Days, Weeks, Months), with a percentage comparison against the previous 31-day period. You can view the chart in either Combined/Separate mode.
The breakout table shows the daily changes that contribute to this trend, including **Active**, **Reactivation**, **Deactivation**, and **Churned** users.
The panels below offer a quick historical comparison of your total active user count against previous months and years.
#### 2. Monthly growth
This chart displays your monthly **Retained** versus **Churned** users, with a line graph showing the overall **Net** growth trend. It helps you visualize your user base health on a macro level, smoothing out daily fluctuations.
#### 3. Plans
This table breaks down your active customers by their subscription plan. It shows each plan’s Interval, the number of **Active Customers**, their percentage distribution, and the total **MRR** each plan contributes.
### How Active Users data can benefit you
* **Measure Market Reach:** The total active user count is the clearest indicator of your app's market adoption and overall footprint. It represents the size of the customer base your application is successfully reaching and retaining.
* **Assess Revenue Potential:** This is the maximum available customer base that you can convert into Paying Users, serving as a key input for revenue forecasting and strategy evaluation.
* **Monitor Overall Health:** A flat or declining active user trend signals potential growth or retention issues. This metric serves as a high-level health check and highlights when further investigation is needed.