> For the complete documentation index, see [llms.txt](https://docs.letsmetrix.com/llms.txt). Markdown versions of documentation pages are available by appending `.md` to page URLs; this page is available as [Markdown](https://docs.letsmetrix.com/shopify-metrics/arr.md).
# ARR
The “ARR” dashboard provides a high-level view of your projected annual revenue, helping you evaluate the long-term financial scale and performance of your application.
### How we get these data
ARR data is gathered from Shopify API App Events to support long-term financial planning and strategic decision-making.
### Understand the dashboard
ARR (Annual Recurring Revenue) is the recurring revenue value annualized. This is an extended version of MRR to look at the long-term financial picture.
**Note:**
* For Monthly Subscription Plans: Usually multiplied by 12 to convert to annual value.
* Includes One-time charges or Usage charges but not multiplied by 12.
* This is projected revenue under the ideal scenario that all paying users will use the app until the end of the billing cycle.
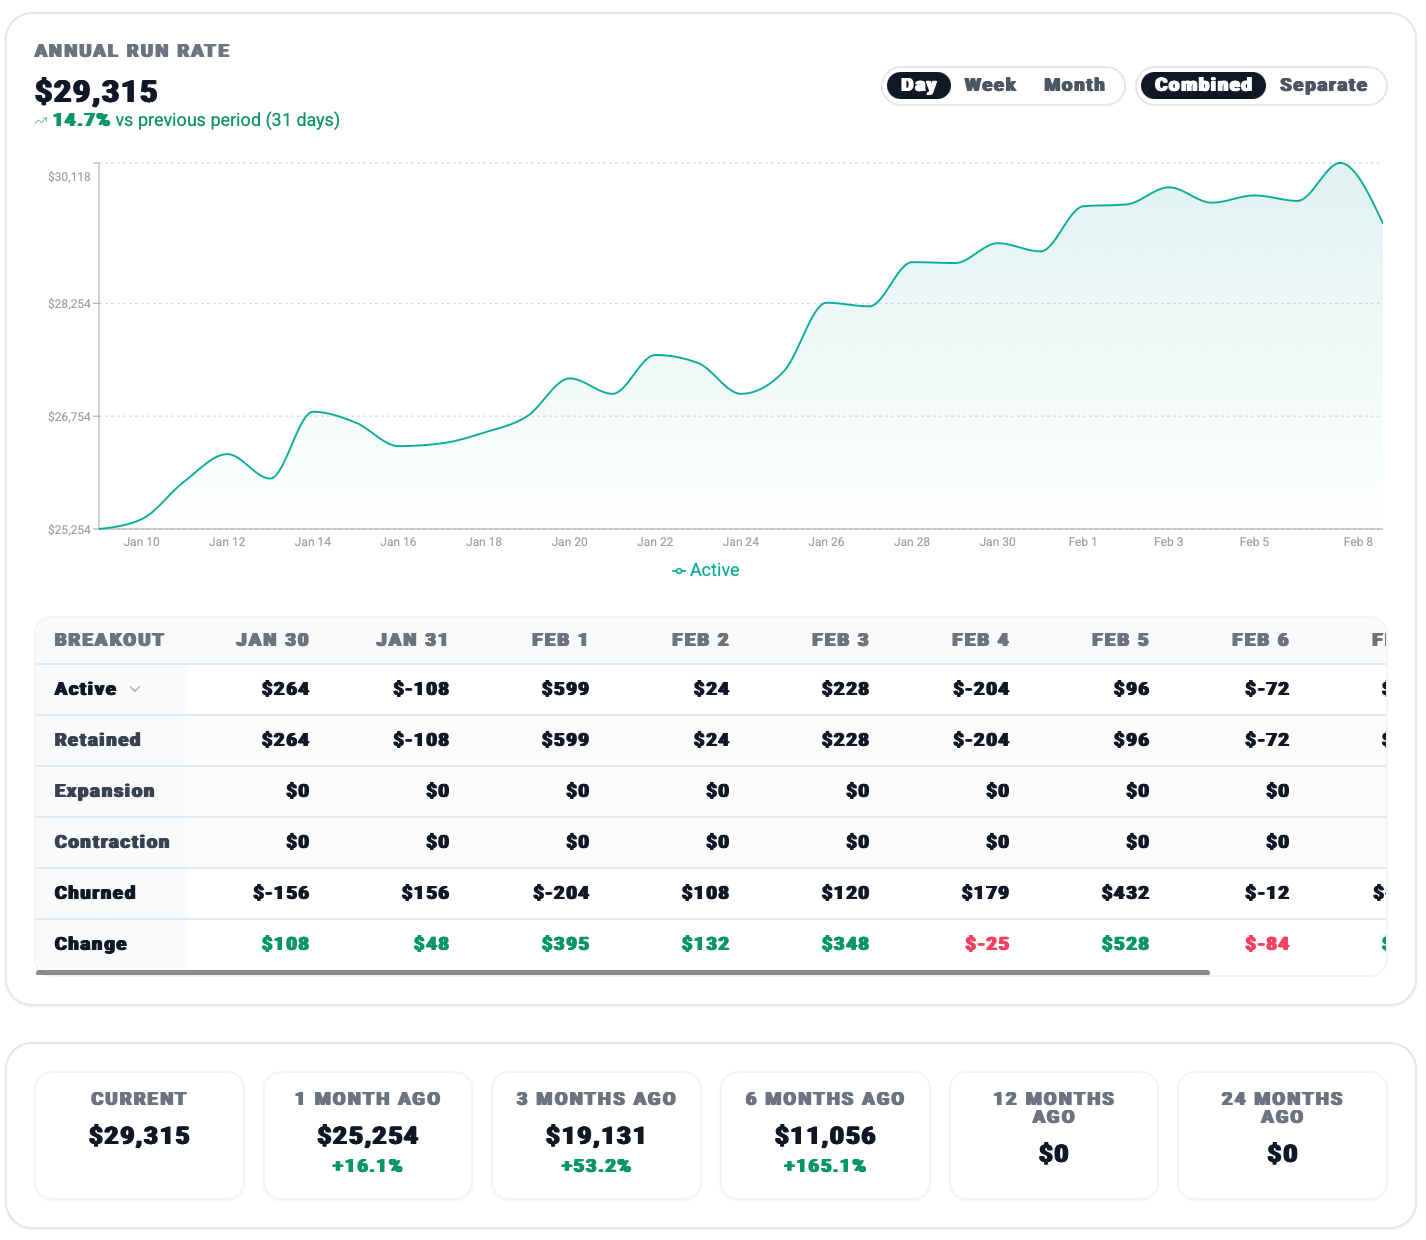
#### 1. Annual Run Rate
The line chart visualizes the total ARR trend over your selected time period (Day, Week, Month), with a percentage comparison against the previous 31-day period, highlighting the overall growth of your business scale. You can view the chart in either Combined/Separate mode.
The breakout table details the daily fluctuations that contribute to this trend, categorizing movements into **Active** revenue gains (including **Retained**, **Expansion** (upsells), and **Contraction** (downsells)), and **Churned** revenue losses to calculate the net **Change** in ARR.
The panels offer a quick historical comparison of your current ARR against performance benchmarks from 1, 3, 6, 12, and 24 months ago to track long-term scaling momentum.
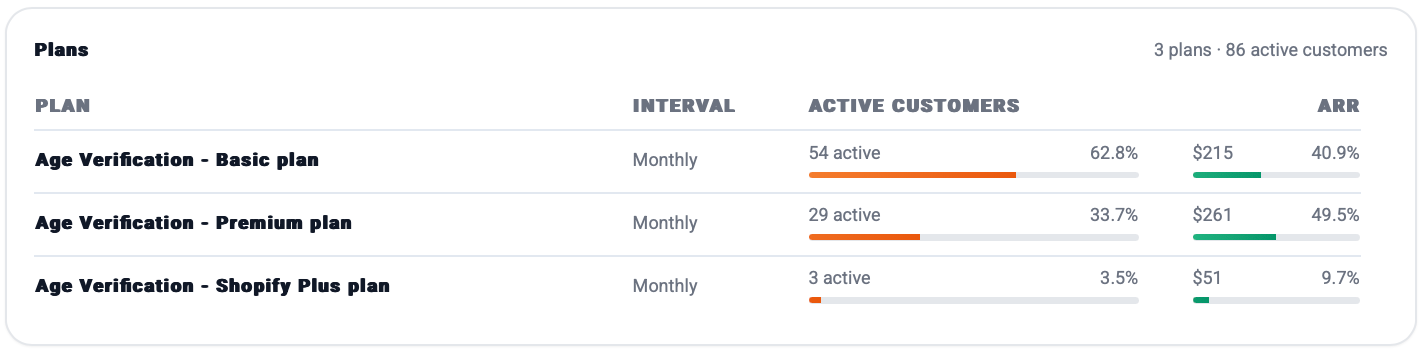
#### 2. Plans
This table breaks down your annual revenue by specific plan levels, showing the number of active customers and the total ARR contribution for each subscription tier.
### How ARR data can benefit you
* **Company Valuation:** ARR is the primary metric used as a scale measure when raising capital, seeking investments, or determining the market value of your company.
* **Long-term Strategic Vision:** This metric is ideal for high-level reporting (C-level) and annual business reviews, as it filters out minor monthly fluctuations to show the true trajectory of the business.