> For the complete documentation index, see [llms.txt](https://docs.letsmetrix.com/llms.txt). Markdown versions of documentation pages are available by appending `.md` to page URLs; this page is available as [Markdown](https://docs.letsmetrix.com/app-insights/app-store-insights-timeline.md).
# App Store Insights Timeline
The timeline gives a daily, chronological view of key activity across the Shopify App Store, helping you track launches, review changes, and overall market trends.
### Understand the App Store Insights Timeline
#### 1. Filters
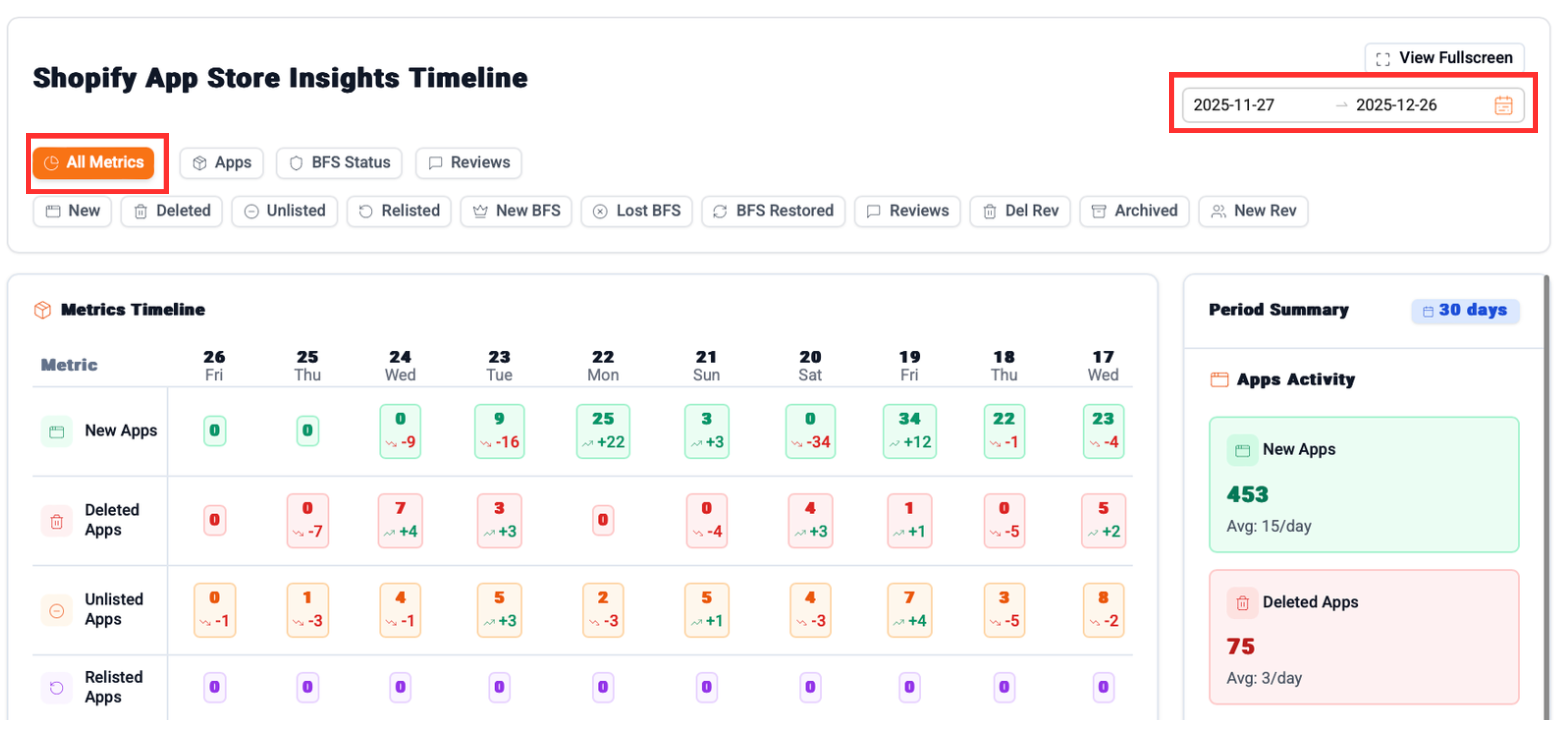
Located at the top, these filters allow you to customize your view. You can select a specific date range and filter the timeline to show **All Metrics**, or focus on specific groups like apps, BFS status, or reviews.
#### 2. Metrics Timeline
This is the core of the dashboard, providing a day-by-day breakdown of key market activities. Each row represents a specific metric, showing the total count for that day and the change compared to the previous day.
* **App Metrics:** Track the number of **New**, **Deleted**, **Unlisted**, and **Relisted** apps.
* **BFS Status Metrics:** Monitor changes related to the "Built for Shopify" status, including **New BFS Apps**, **Lost BFS Status**, and **Restored BFS**.
* **Review Metrics:** See the daily volume of **New Reviews**, **Deleted Reviews**, **Archived Reviews**, and **First-time Reviewers**.
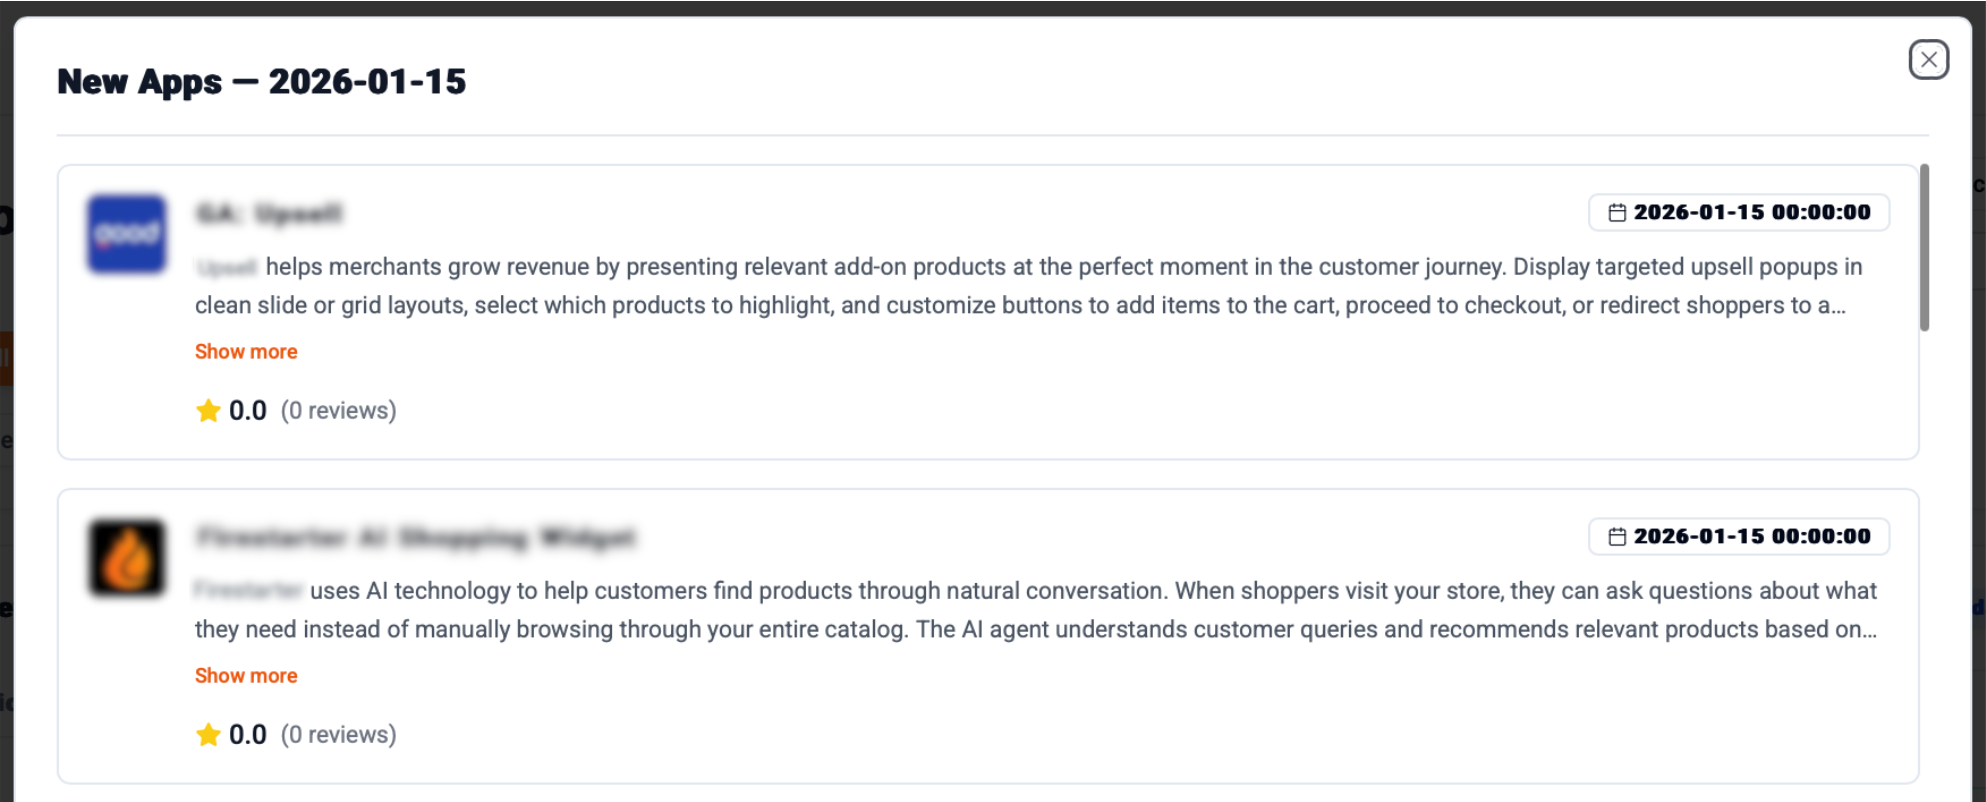
The numbers in each cell are clickable. Click on any number to open a popup window that displays a detailed list of the specific apps or reviews corresponding to that metric for that day.
### How App Store Insights Timeline can benefit you
* **Monitor Market Growth:** By tracking the daily numbers of app launches versus removals, you can gauge the overall growth and churn of the App Store. This helps you understand the current level of market saturation and competitive intensity.
* **Track Quality Benchmarks:** The timeline provides direct insight into how many apps are gaining or losing important quality badges from Shopify. It helps you assess the competitiveness and significance of achieving these benchmarks in the current market.
* **Identify User Sentiment Trends:** The review metrics allow you to see the big picture of user feedback across the entire ecosystem. This can help you identify platform-wide events or changes that are impacting user sentiment on a macro scale.
* **Spot Daily & Weekly Patterns:** By observing the timeline over a longer period, you can identify patterns in market activity. This intelligence can help you time your own launches and marketing campaigns more effectively to maximize visibility and impact.